Track Your Digital Product Sales and Analytics in Notion
Build a Notion sales dashboard that turns scattered Gumroad and Stripe payouts into the three numbers that actually tell you what to do next.
Your sales data is probably scattered across four dashboards — Gumroad here, Stripe there, an email tool, a spreadsheet you abandoned in March. So you never actually look at it, and you make decisions on vibes. A simple Notion dashboard fixes that by pulling the numbers into one place and computing the few that matter.
This is the setup I use to track digital product sales without buying analytics software.
The three numbers that matter
Ignore vanity metrics. For a small digital product business, almost every decision comes down to three figures:
- Revenue per product — what's actually carrying the business
- Conversion rate — sales divided by page views, per product
- Revenue trend — is this month beating last month
Everything in the dashboard exists to surface those three. If a metric doesn't change a decision, it doesn't go in.
Database 1: Products
One row per product you sell. Properties:
- Product (title)
- Price (number)
- Page views (number — pasted from your platform monthly, or via integration)
- Sales (rollup → count of related Sales rows)
- Revenue (rollup → sum of related Sales' amount)
- Conversion % (formula:
Sales / Page views) - Status (select: Live, Draft, Retired)
The Conversion % formula is the one that earns its keep. A product with great revenue but a 0.5% conversion rate has a page problem, not a product problem — and that's a fixable, specific insight.
Database 2: Sales
One row per transaction. You can import this from a Gumroad/Stripe CSV export or log manually for low volume. Properties:
- Order (title — order ID or buyer)
- Product (relation → Products)
- Amount (number — net of fees if you want true revenue)
- Date (date)
- Source (select: Direct, Email, Social, Affiliate)
- Refunded (checkbox)
The Source field is underrated. After a few dozen sales you'll see whether your email list or your social posts actually drive revenue — and you can stop pouring time into the channel that doesn't.
The formulas worth setting up
Notion's formulas cover everything you need here:
- Conversion % (Products):
if(prop("Page views") > 0, prop("Sales") / prop("Page views"), 0)— format as percent. - Net revenue (Sales):
if(prop("Refunded"), 0, prop("Amount"))— so refunds don't inflate totals. - Average order value (dashboard): total revenue ÷ total sales.
Keep them simple. The goal is a number you trust, not a spreadsheet you maintain.
Building the dashboard views
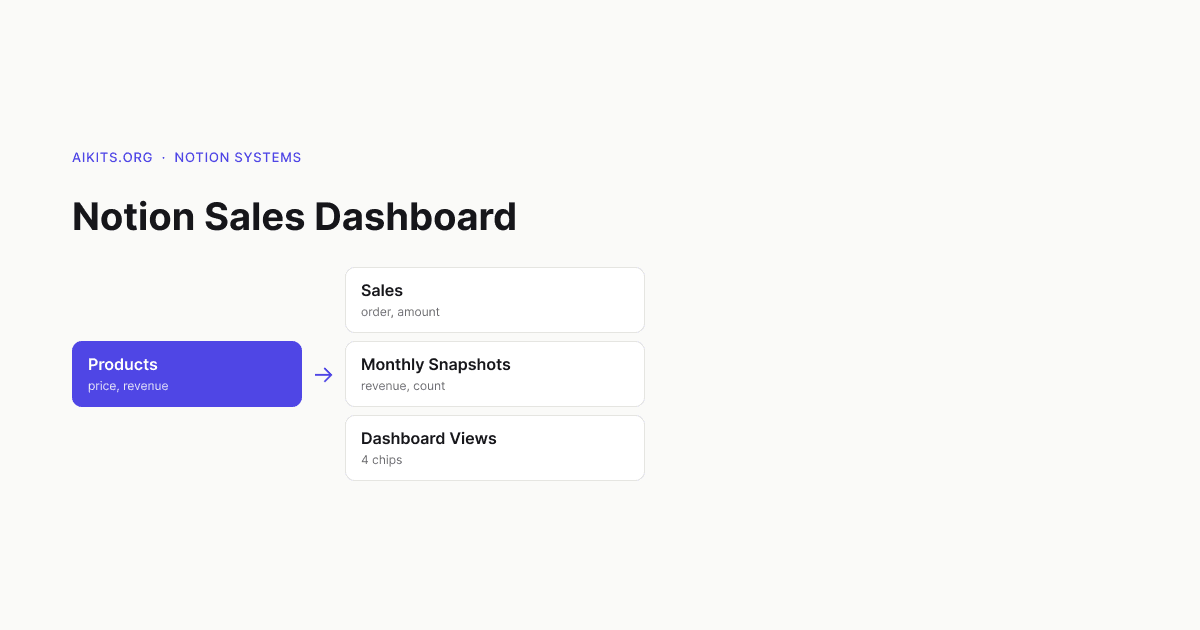
Create a single page called "Sales Dashboard" and drop in linked views of the two databases:
- Revenue by Product (Board or Table) — Products sorted by Revenue descending. Your hero product is at the top; your dead weight is at the bottom.
- This Month (Filtered table) — Sales where Date is within the current month. Add a sum on Amount at the bottom.
- Conversion leaderboard — Products sorted by Conversion %. Low converters are your optimization queue.
- Sales by Source (Board) — group Sales by Source to see channel performance.
Getting data in without manual entry
Logging every sale by hand gets old fast. Two approaches scale better:
- CSV import. Gumroad, Lemon Squeezy, and Stripe all export sales as CSV. Notion imports CSV straight into a database — match the columns to your Sales properties and you're done in under a minute per month. This is the sweet spot for most creators: zero ongoing cost, five minutes monthly.
- Automation. If volume justifies it, tools like Zapier or Make can push each new sale into your Notion Sales database automatically. Set it up once and the dashboard updates itself. Only worth it past a few sales a day — below that, the monthly CSV is simpler and free.
Whichever you pick, keep one rule: the Amount field should be net of platform fees if you want the dashboard to reflect real take-home revenue, not gross.
Reading the trend without a chart
Notion's native charting is limited, so use a lightweight monthly-snapshot trick. Create a third tiny database, Monthly Snapshots, with: Month, Revenue, Sales count, Notes. On the first of each month, log last month's totals in one row. After three months you have a clean trend line you can scan in seconds — and you're not relying on any platform keeping your history.
What to actually do with it
A dashboard is only useful if it changes behavior. Once a week, open it and ask:
- Which product makes the most money? Make more like it.
- Which has the worst conversion? Rewrite that sales page.
- Which source drives the most revenue? Double down there.
- Is this month beating last? If not, why — fewer launches, less posting, a dead channel?
That's the whole loop. Four questions, four decisions, every week.
The takeaway
You don't need analytics software to run a digital product business — you need three numbers in one place and the discipline to look at them weekly. Two databases, a couple of rollups, and a conversion formula give you a dashboard that's good enough to drive real decisions. Build it once, log sales as they come, and stop guessing.